About one half of the global population presently lives in cities. This percentage increasingly poses a challenge before cities for adoption of new practices of conserving natural resources. How green are our cities? How do ours compare with other green cities? Are we making enough progress in becoming sustainable by a global standard? There is no authoritative measurements to answer these questions, especially for the cities of developing countries. But we can move forward to clarify these questions through achieving the criteria of a green city. An exciting message of the prospective work is discussed here with many ways to assess the ecological footprint of cities and the relative measures for sustainability.
Ecological footprint measures the status of both production and consumption utilising our natural resources. For understanding green or sustainable city, it is a very important issue to know how much water and land area a city requires for creating sufficient resources, as well as how much of that we are consuming and releasing as waste to Nature. We need to understand our individual daily lifestyle and practices alongside with the respective value of our natural resources and their significant uses in terms of high density cities. Because, by minimising ecological footprint, we can support our cities to improve its sustainability and well-being, optimise project investments publicly, and individual understanding of the sole impact on the Earth.
An ecological footprint is calculated in global hectares (gha) per capita. Literally, a country containing less per capita ecological footprint may be in a good position towards achieving sustainability, but it is not always the case unless we would consider our per capita 'biocapacity'. The biocapacity or biological capacity is an estimated natural absorption capacity in contrast with resource production, consumption and waste release at individual level. For example, it concerns our individual carbon emission versus its absorption and filtration scope in Nature.
The data show that Bangladesh is one of the least significant countries in contributing to the individual ecological footprint to Nature. Our present ecological footprint value is 0.72 (biocapacity deficit -0.38), whereas the global average value is around 2.6 and global average biocapacity deficit is -1.1 gha per person. Here the biocapacity deficit is shown as a negative value, which indicates that against the global context, Bangladesh with the existing natural resources has no more capacity to absorb further emissions. The positive biocapacity of a country is a good message for it in the context of its resource extraction and uses. Therefore, this value can explain what our future design will be on resource production, consumption and conservation practices within the present natural resources.
We can show some more data of different countries for better understanding of the situation. According to the latest data of the Global Footprint Network's Explorer, the analysis of 188 countries is carried out over the period of 1962 to 2013 and data released in April 2017. Among these countries, almost 135 countries are found with deficit biocapacity (negative value). For example, most significant countries of biocapacity deficit: Luxembourg (-14.14), Aruba (-11.31), Qatar (-9.56), the United States (-4.46), Kuwait (-7.58), Singapore (-7.92), the United Kingdom (-7.37), Belgium (-6.25), and Switzerland (-4.48). On the other hand, about 52 countries have 'reserve biocapacity' (positive value). For example, most significant countries with reserve biocapacity are like: French Guiana (+109.01), Suriname (+85.08), Guyana (+63.51), Gabon (+24.29), Bolivia (+13.77), Mongolia (+9.58), Australia (+7.26), Canada (+7.83), Finland (+7.57), Uruguay (+7.41), Paraguay (+6.36), Brazil (+5.97), New Zealand (+4.54), Sweden (+3.38), and Norway (+3.19). Only one country 'Sierra Leone' has been found to have maintained a balanced between its per capita ecological footprint and biocapacity, which is 1.24 in both cases.
This footprint and biocapacity value of each country may explain its emission status from many aspects. Footprint is not contributed in the same way for all countries. It depends on some factors and the specific context of a country like its population size, areas, available resources (land, water and energy) and individual lifestyle. For example, more people of London city use public transport compared to almost any other cities in the United Kingdom. That means the UK is reducing the bulk amount of its footprint through the development of transport strategy in big cities. When we consider the data with many of our neighborhoods, the biggest footprints are found in high income countries or cities, where the lifestyle is more aristocratic with luxurious residences, private automobiles, consumption of precious food, or other excessive consumption practices.
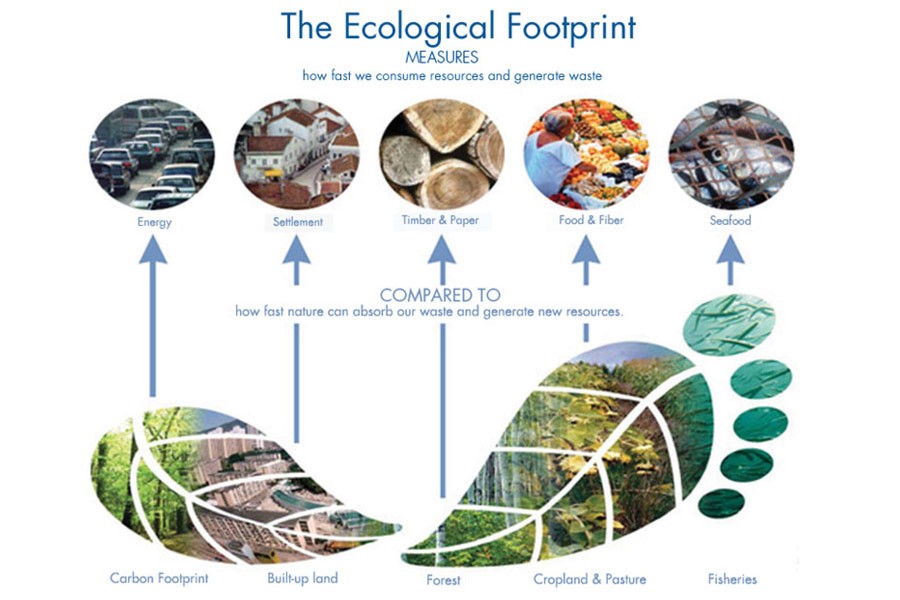
As we achieve sustainable development goals (SDGs), the city planning should be very realistic in terms of its natural resources and absorption capacity of a huge amount daily waste we produce. Certain urban structure or their restructuring would reduce carbon footprint gradually, especially, when we could integrate our cities' resources -- land, water and energy into more compact services for urban growth. On a massive scale of the city's sustainability, we always need to think about our individual contribution to the ecological footprint, which could be measured on comparison between all our resources and their harvesting to meet the current demand. Policymakers and city planners may divide the whole ecological footprint into five service sectors -- energy, settlement, forest, general food and seafood. We need to improve these metrics, including any of the new ones in the context of our city's critical challenges (e.g. public transport, traffic, water pollution, waste management etc), so that these will create a standardised and simply understood footprint index of city sustainability. With a standard data source, existing policies can be assessed and institutions hold to be accountable in reserving or increasing a city's biocapacity. Then the planners and citizens would be able to see how sustainability-related indicators correlate with the SDGs.
Polin Kumar Saha is a Senior Research Associate and Sustainability professional at BRAC Research and Evaluation Division.
polin.msls2009@gmail.com; polin.kumar@brac.net
© 2026 - All Rights with The Financial Express