Does no-vote matter?
Md Jamal Hossain | Friday, 6 February 2015
Is no-vote significantly different from not-voting since in both the cases people don't vote for the existing political parties partly due to their lack of trust in those parties and partly because they don't want to elect them or they don't care about voting at all? The answer is yes. Giving no-vote is significantly different from voting for none. When people don't vote at all, they don't provide any significant signal to political parties in the sense that their actual preference remains hidden - a fact that makes the case quite ambiguous. But, when people vote but give no-vote, they provide a signal expressing explicitly their preference.
To illustrate the case, we can imagine a two-party democratic regime in which people either vote for one of the two parties called A and B or they don't give vote at all assuming that there is no provision for the no-vote option. Assume that there is no-vote option for voters if they don't want to vote for none of the two parties but they want to vote. Now, the total number of votes is the summation of the total number of votes for A, the total number of votes for B, the total number of votes for the no-vote option, and the total number of forfeited votes (the total number of people who do not go to vote for any option at all). Let's say that 50 per cent of the total number of votes comes from voting for no option, that 20 per cent of the total number of votes come from voting for the no-vote option, that 20 per cent of the total number of votes comes from voting for A, and that 10 per cent of the total number of votes comes from voting for B. According to the majority rule, A will win by getting 20 per cent of total votes.
Notice that the percentage of total votes for the no-vote option and the percentage of total votes for A are equal. Since no-vote is simply an option doe not any party, there is no scope that no-vote will win even if it gets 20 per cent of the total votes. What is more interesting to note is that the highest number of majority votes comes from not voting for any option. That means 50 per cent of the total eligible voters have not voted at all. But the influence of 20 per cent no-votes in the political field must be more than the influence of 50 per cent votes that comes from not voting for any option. The reason is that no-votes provide observational statistics for the emergence of a third party. In other words, no-votes create the prospect for a third party. And this signal is derived from observing the trend of no-votes. No-votes imply that voters providing no-votes do not want to vote for the current political parties named A and B. This in turn means that they would vote for a third party if it exists in reality. Following this line of reasoning, we say that no-votes constitute majority votes for another party called C which has just emerged in the political field due to the no-vote option. From the above we see that the result is drawn between C and A since both of them get the same number of majority votes. If you are not convinced by the above verbal reasoning, then we can offer the following technical illustration:
We can present the above analysis graphically as follows:
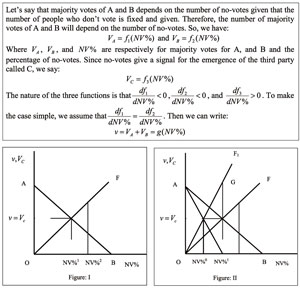
In the figure I, the percentage of no-votes is measured on the horizontal axis, and the majority votes of the party A and B combined (v) and the majority votes of C (VC) are measured on the vertical axis. The downward sloping line AB shows that as the percentage of no-votes increases, majority votes of A and B combined decrease, and as the percentage of no-votes decreases, the majority votes of A and B combined increase. On the other hand, the upward sloping line OF shows that as the percentage of no-votes increases, the majority votes of C increase. When the percentage of no-votes is NV%1, both A and B combined and C get the same number of majority votes, and the result is either A or B will win. But as the percentage of no-votes increases up to NV%2, C gets more majority votes than A and B combined and thus wins. One of the characteristic features of the downward sloping line AB is that over time the slope of this line will increase in the absolute term. That means, line AB will get steeper over time. Steepness indicates that small change in the percentage of no-votes will cause large change in the majority votes for A and B combined; majority votes of A and B combined will decrease sharply. At the same time, slope of the upward rising line OF will increase over time. The change in the slope is due to the stronger feedback which is triggered by the introduction of the no-vote option in a society. Over time feedback will assume stronger shape and form. If we combine both changes in slope, we get the following view:
Since the slope of the downward sloping line has increased in the absolute term and the slope of the upward rising line has increased too, figure II shows that at very small percentage of no-votes NV%0, the majority votes of A and B combined and of C are equal. When the percentage of no-votes is NV%1, the majority votes of A and B combined are almost equal to zero, and the majority votes of C are given by the vertical distance NV %1G. The majority votes of C exceed the majority votes of A and B combined when NV% is zero. This means that the percentage of people who do not vote at all decreases when the no-vote option exists. This is another reason why no-votes makes a lot of difference, and the effect of not voting for any option and no-votes is not symmetric at all. No-vote is a powerful instrument to bring changes in a society.
The writer is a faculty member of North South University.
jheco.du@gmail.com