Economic growth & road transport in Bangladesh
A Kuznets Curve analysis
Syed Sabiq Ashraf and Nafisa Mesbah | Thursday, 30 November 2023
According to the World Bank, Bangladesh has been one of the fastest-growing economies in South Asia in recent decades, with an average Gross Domestic Product (GDP) per capita growth of above 5 per cent in the last decade. Moreover, the per capita income has also been steadily increasing and now exceeds neighbouring India’s. Such impressive economic growth has been accompanied by the increased number of vehicles on the roads. With economic prosperity and activities, the movement of people has increased manifold, and to facilitate their movements, there has been an uptick in the number of transport services and investment in road infrastructures. This article will discuss the impact on road vehicles due to economic developments in Bangladesh by running a Kuznets Curve Analysis.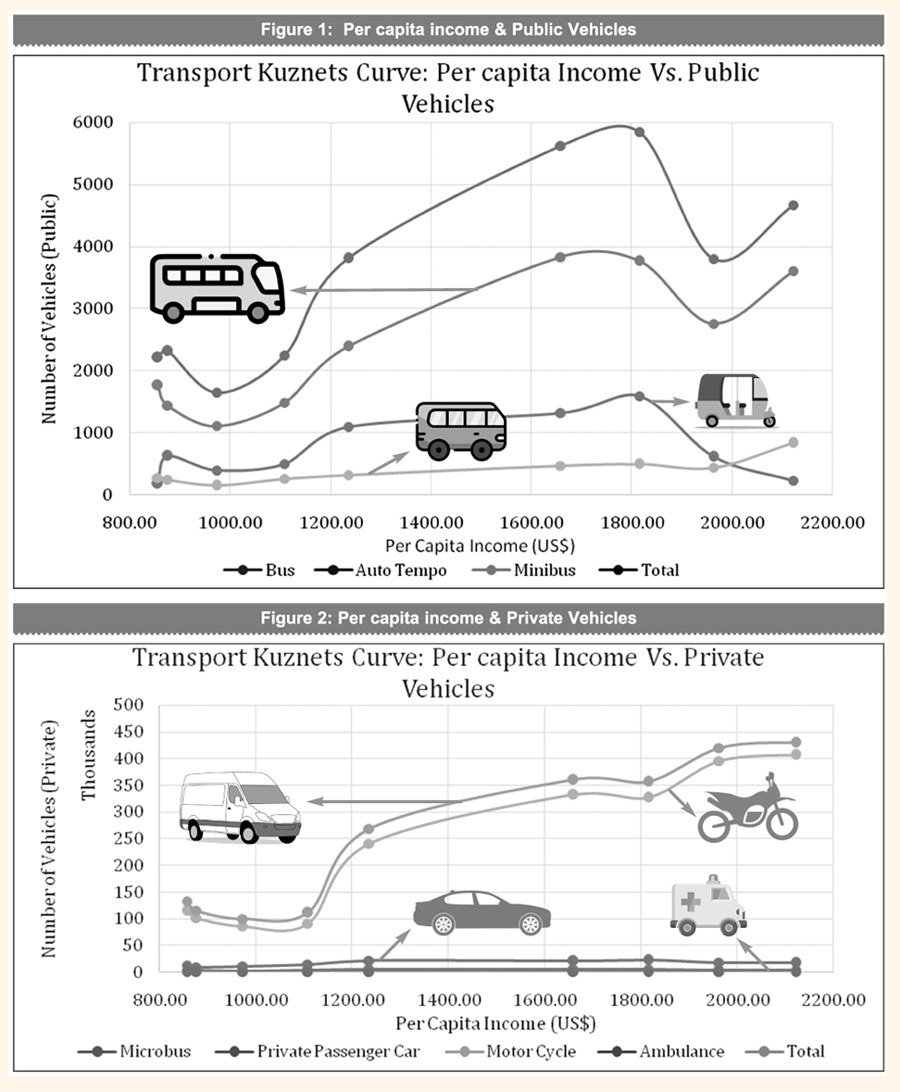 As of June 2020, the number of road vehicles registered under the Bangladesh Road Transport Authority (BRTA) stood at 4,471,625. According to the Bangladesh Bureau of Statistics, the average growth was 7.5 per cent from 2010 to 2020, encompassing all types of vehicles, from bikes to buses. A correlation exists between the increase in vehicles and the country’s per capita income, as the per capita income has also been rising with a year-on-year rate of 9 per cent in the fiscal year of 2021-2022, at US$ 2824.
While buses and ‘auto tempoes’ (three-wheelers) are the key means of public transportation, micro buses, private passenger cars, motorcycles, and taxi cabs are considered private transports. Under this consideration, the number of public road transport vehicles is 101,687, and that of privately owned road transport vehicles 476,415, according to BRTA.
TRANSPORT KUZNETS CURVE: Kuznets curve expresses a hypothesised relation among industrialised nations experiencing a rise and subsequent decline in income inequality. American economist and Nobel laureate Simon Kuznets first proposed the Kuznets curve in the middle of the 1950s. The relationship between inequality and per capita income in an economy is represented by an ‘inverted U’ in the Kuznet curve. In other words, growth in a weak economy would inevitably lead to greater income inequality.
To establish a Kuznets curve analysis for public transport, the number of public vehicles from 2011 to 2019 is on the horizontal axis, and data on per capita income is on the vertical axis for the same period. In addition, the same is true for the one analysing private transports by taking the number of privately owned vehicles from 2011 to 2019 on the horizontal axis and data of the per capita income on the vertical axis. The vehicle data are provided by the Bangladesh Road Transport Authority (BRTA) Website. However, the data from 2020 is not taken because it is not representative of the typical trend due to the pandemic.
In Figure 1, public transport formed a rough Kuznets curve along the per capita income until 2018. Still, the number increased slightly in 2019, emphasising government investment in the sector. However, in Figure 2, there is a different scenario. Private vehicles failed to establish a Kuznets curve along the per capita income. Over the years, the number of private vehicles tended to rise as the per capita income rose in the country and eventually plateaued in 2018 and 2019. So, even though public vehicles and per capita income form a Kuznets curve, it’s not the case for private vehicles.
WHAT THE FINDINGS TELL US: The per capita income (as imperfect as it may be) gives a glimpse of the economic prosperity of the people in the country. With the increase in per capita income and economic development, there was initially an upward trend in the number of public vehicles on the roads. Still, with further economic prosperity, the number fell. The reason why it fell is reflected in Figure 2. As income increases, people tend to spend that money on luxuries; in this case, it is private transportation. That is the key reason why the number of private vehicles is increasing.
Moreover, another reason for the upward trend in the number of private vehicles is that the country’s public transportation condition is substantially poor from a global standpoint. Traveling in public transportation is time-consuming and largely inconvenient due to delays. This remains a key reason why many commuters consider private transport a substitute for public ones, especially bikes. In recent times, there has been a substantial increase in bike sales; bikes are substituted for public transport. People can expect to see this upward trend in private vehicles in the future if the public transport sector is underfunded and lacks reform.
The Kuznets analysis gives us a glimpse of comparing public and private transportation. This helps to understand the economics of transportation and how it influences people’s decisions in availing private and public transportation, as the findings expound on the rationale of people substituting public transport by private ones.
Syed Sabiq Ashraf and Nafisa Mesbah are students, Department of Economics and Social Science, Brac University.
sabiqashraf47@gmail.com
nafisa.mesbah@g.bracu.ac.bd