Election analysis and voting manipulation: A theoretical exercise
Md. Jamal Hossain | Sunday, 26 January 2014
It can be late to publish such estimate but we regard that it is not late enough because the analysis developed here will not only help us give an estimate of election outcome but also make some predictions about the political future of our country. Before the January 05 election, the fear of voting manipulation grabbed the public debate and it is claimed that some major parties did not participate in the election for this kind of fear. The logical question to ask is: Is it possible that voting manipulation can change the predicted result?
Long ago, Herbert A. Simon proved that election prediction is confirmed by the actual polling result. He argued, using the complex fixed point theorem, that election prediction is confirmed by the actual polling result. However, it is not only unnecessary to replicate his complex and highly sophisticated mathematical arguments here but also irrelevant because he didn't analyze the case of voting manipulation in sufficient details. The only thing he analysed is whether election prediction is confirmed by actual polls. To show whether voting manipulation can change the election prediction, we need slightly different framework not exactly like Simon's. This is the primary aim of this article to develop a more simplified view that can take account of voting manipulation and to derive the answers for the following questions: (a) Can voting manipulation change the election prediction and if so, when and in what circumstance? (b) Is the voting manipulation fear is relevant at all to the predicted actual election outcome? To get all of them, we first state the necessary assumptions and then develop the analysis.
ASSUMPTIONS: To build a compact analysis we need to proceed systematically making solid assumptions. So, we take the following assumption as the building blocks for the whole analysis: (1) We assume that there are only two parties called A and B who are running for election and each and every person either votes for A or B but not for both. (2) A person's probability of voting for either A or B depends on the information he possesses at the time of voting given the information possessed by other persons. (3) We assume that there exists a bandwagon effect; that means a person is more likely to vote for A if other people are more likely to vote for A and vice versa. (The term 'Bandwagon' is borrowed from Herbert A. Simon (Models of Bounded Rationality Vol. 2)
ANALAYTICAL FRAMEWORK: Since we have taken the assumption whether a person will vote for A or B depends on the information he possess at the time of voting given the information possessed by other persons, we can translate this in the simple language of mathematics as follows:
Given these preliminary calculations, we can now hypothesise that the percentage of the total vote or majority vote A or B will get depends on the probability estimate of each and every person. Therefore, we proceed as follows:
Now, we are faced with a plethora of information and too much complexity because we needn't only know what exactly we think, but also what others also think. This is something probing into people's mind and mirroring their minds. Fortunately we needn't do that. Our assumption of bandwagon effect helps us to simplify the analysis and make it more straightforward. We argue when there is a bandwagon effect information will be more or less perfectly spread, and information possessed by each person is assumed to be the same. This is the one simplification that will help us a lot. Another is that it doesn't matter whether the probability of voting for A for person one is greater than the probability of voting for A for person two as long as they are to vote for A. We say more precisely:
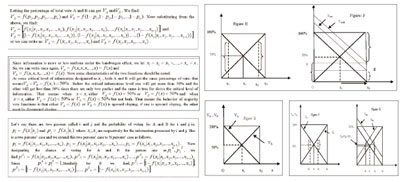
Now the big question is which one is downward sloping and which one is upward sloping? It all depends on in which favour bandwagon effect is. If it is in favour of A, then VA is upward sloping and if it is in favour of B, then VB is upward sloping. We take for simplicity that VB is upwards sloping. Therefore, VA must be downward sloping. This is illustrated in the following graph:
In the above figure E, the percentage of total vote for A and B candidates is measured on the vertical axis and information (x) on which voting percentage depends is measured on the horizontal axis. As said above, there exists a critical information level at which the election outcome would be 50 per cent-50 per cent and this critical information is leveled as xc in the above figure. The graph shows that there also exists an information level at which one party will get zero percentage and other will get the 100 per cent of total vote and one of this is leveled as x0. At x0 A gets zero percentage and B gets 100 per cent. Similarly, at the origin point O, A gets 100 per cent and B gets zero percentage.
This is all we need as an analytical preliminary to analyse the voting manipulation cases and derive the answer to questions posed above. Let's now turn to the voting manipulation analysis.
VOTING MANIPULATION ANALYSIS: The critical question to ask is whether voting manipulation can change the predicted result. Before we answer the question it is important that we clear some points. First, information is treated in such a way that at first we have fixed the critical level which is xc and then we have analysed the voting manipulation case when x>xc and when x
(1) VOTING MANIPULATION IN THE SMALL: Voting manipulation in the small, as said, happens when present information level (x) is close to the critical information level (xc). In such instance, manipulation can have significant effect on the predicted election outcome. This case is illustrated in the following figure F and G:
In the figure F, percentage of total vote for A and B is measured on the vertical axis and information on the horizontal axis. It shows that at the critical information level xc nobody wins the election and the outcome is 50-50. But at the information level x1 A wins and B loses and the difference in the percentage of vote between A and B is shown by the bracket over the dashed line. On the other hand, at the information x2 B wins and A loses. The graph F shows that distance between x1 and xc is not very much and so is true for the distance between x2 and xc. That means this is a suitable case for the analysis of voting manipulation in the small. But the question is: how to generate the voting manipulation case in the graph F? Well, the trick is to shift the curve corresponding to a particular party in which favour manipulation is taking place. This is done in the Figure G. when voting manipulation happens in favour of party A, the curve shifts to the right side shown as VAA in such way that percentage of total vote for A increases, and when voting manipulation happens in favour of B, the curve shift to left side shown as VBB in such way that percentage of total vote for B increases. Since at the information level x2 A loses and B wins and at the information level x1 A wins and B loses by a smaller margin of difference in the percentage of total vote, voting manipulation by either one can significantly change the predicted outcome irrespective of other conditions. Let's say manipulation happens in favour of party A. If so, then VA must shift to the right side and becomes VAA. Before voting manipulation, at the information level x2 A is bound to lose and B is to win. Now, after the voting manipulation, A gains some percentage of total vote in such way that it ultimately ends up with a percentage that is well above 50 per cent which is shown in the figure G as VA>50 per cent; that means VB <50 per cent. In other words, now A wins and B loses. Similarly, when manipulation happens in favour of B, VB shifts to the left side and becomes VBB. Then, whereas at the information level x1 B was bound to lose before the manipulation, now it wins after the manipulation. That means it gets above 50 per cent of the total vote or VB>50 per cent. This analysis shows when x is very close to xc at which the result is 50-50, voting manipulation even in the small scale can change the predicted election outcome and falsify the prediction. That means A can tilt the unfavourable election outcome to its favour by voting manipulation and ultimately wins the election and so is true for B. Now, let's see what happens when x is far away from xc in the both ends - the voting manipulation in the large.
(2) VOTING MANIPULATION IN THE LARGE: Voting manipulation in the large happens when x is far away from the xc in the both ends and this is shown in the figure H in which we see that the distance between x1 and xc is large and so is true for the distance between x2 and xc. For this case, voting manipulation is analysed in the figure J. Here for simplicity and to reduce the redundancy, we have analysed voting manipulation for only A shifting VA twice to the right side. Another thing is that we will analyse the voting manipulation case here taking the extreme information level at which A gets zero percentage of total vote and B gets 100 per cent of total vote. This is done for only to make the exposition very clear-cut and lucid and this extreme case will not anyway affect the main conclusion that we are going to derive soon.
In the figure H, the percentage of vote for A and B is measured on the vertical axis and information level on the horizontal axis. The graph shows that two information levels in the two sides is very close to the extreme points; x1 is very close to the origin point and x2 is very close to the x0 and at the both of these extreme points one gets 100 per cent and the other gets zero percentage. For example at the origin point A gets 100 per cent and B gets none and at the x0, B gets 100 per cent and A gets none. In this instance, voting manipulation is analysed in the figure J. Since it is a voting manipulation case in the large, we take, for example, x0 and see how manipulation can change the predicted result. Before voting manipulation, at x0 A was bound to lose since it would get zero percentage and B was to win as it would get 100 per cent. Now after the manipulation that happens in favour of A shown by the shift of the curve VA, A manages to get some percentage of total vote. But the question is how much would it be able to get by such manipulation? Let's say the first degree of manipulation happens when VA shifts to the right side and becomes VAA. At this scale of manipulation, A manages to get from zero percentage to x0K percentage of vote which is still very small indeed. Therefore, at this scale of manipulation it is impossible to alter the result and B will win anyway. Let's say there is a second degree of manipulation and this is shown by the shifted curve VAAA . Now, at this scale of manipulation, A manages to achieve somewhat more percentage of votes than it got at the previous scale. Therefore, it gets OE percentage of total vote which is still less than 50 per cent at which none wins. So, even at this second degree of manipulation A will not be able to alter the predicted election outcome and B will win getting (100 per cent-OE per cent) percentage which is obviously greater than 50 per cent. Now the question is: is there any possibility of the third degree, the fourth degree and so on the Nth degree manipulation that A ultimately will get over 50 per cent and win the election? This is the most vital question to answer here otherwise we will not be able give any definite conclusion. The answer itself depends on the two things: (a) the distance between xc and x0 and (b) the limit on the manipulation. These two forces interact with each other and such interaction imposes a limit on the voting manipulation. The greater the distance between x and xc, the stronger the bandwagon effect. In the above figure, strong bandwagon effect is in favour of B. In such condition, x will put such effect on the manipulation that it will limit the voting manipulation below 50 per cent; that means no matter how much A tries to manipulate voting to change the predicted result, it will not be able to change the result. Anyway, B will win the election by getting at least one percentage more vote than A irrespective of the degree of manipulation can happen in this voting manipulation in large case.
VOTING MANIPULATION: THEORY AND REALITY: The above two-party based election analysis is a perfect set-up to analyse Bangladesh's election. To sum up and relate the above theoretical analysis to our country's election, we can say that if manipulation happens in large, no matter how much the one party tries to change the predicted election outcome it will not able to change the election outcome. Let's say B tries to manipulate the election outcome at the information level designated x1 in the H figure by shifting VB curve to the left side. By this, it will be able to increase the total percentage of cast vote from a very low level to a moderate level, but it will never be able to cross 50 per cent barrier by such manipulation and A will win the election by getting at least one percentage more vote than B irrespective of the degree of voting manipulation that can happen at x1. On the other hand, if A tries to manipulate vote at the information level x2 in the figure H, similarly, it will not never be able to cross 50 per cent barrier and B will anyway win the election by getting at least 1.0 per cent more vote than A irrespective of the degree of manipulation that can happen at x2.
To conclude, under the strong bandwagon effect in favour of both A and B respectively, A will win the election by getting at least 1.0 per cent more majority vote than the B no matter how much B tries to manipulate vote, and similarly B will win the election by getting at least 1.0 per cent more majority vote than A no matter how much A tries to manipulate vote. Thus, we have got the answer to our first question. The answer is that voting manipulation can't change the predicted outcome when manipulation happens in the large as shown in the figure H and J, but voting manipulation can change the predicted outcome when manipulation happens in the small as shown in the figure F and G. The current political situation indicates that if voting manipulation happens in any election in Bangladesh, it will happen in the large. Therefore, the voting manipulation fear and its power to change the predicted outcome in the election can't be logically supported at all. This is the answer to our second question.
Md. Jamal Hossain writes from the University of Denver, USA. jheco.du@gmail.com