Inflation & wage dynamics in BD
A review of the price and wage development in Q1 of FY26
Md Golzare Nabi, Nurun Nahar Sultana, Alok Roy, Md Masudur Rahman, Md Jahedul Islam, Farah Nasreen, Md Ashik Ali and Mohua Akter | Thursday, 6 November 2025
Bangladesh Bank, as a forward-looking central bank, is dedicated to maintaining price stability and a robust financial system by promoting inclusive and broad-based economic growth, job creation, and poverty reduction. A sound comprehension of the fundamental elements that influence price level movements is necessary for the formulation of effective monetary policy. This paper examines the main forces influencing Bangladesh’s Consumer Price Index (CPI) inflation and wage trends which offers a thorough analysis of the variables influencing the inflation dynamics of the nation. Currently, the Bangladesh Bureau of Statistics (BBS) compiles the Consumer Price Index (CPI) following the Classification of Individual Consumption by Purpose (COICOP) of the United Nations Department of Economic and Social Affairs, using 2021–22 as the base year, with weights derived from the Household Income and Expenditure Survey (HIES) 2016–17. Similarly, the Wage Rate Index (WRI) is based on the same period, with weights from the BBS Labour Force Survey (LFS) 2016–17.
 As per Asian Development Bank in its Asian Development Outlook (September 2025), Bangladesh’s inflation is expected to ease from 10 per cent in FY25 to 8 per cent in FY26 amid tighter monetary policy. The assumption of favourable weather conditions, easing global oil prices, the implementation of stricter policy measures will contribute to further decline (ADB, 2025). However, the International Monetary Fund (IMF) in its October 2025 World Economic Outlook (WEO) noted that worldwide headline inflation is predicted to fall in 2026 to 3.7 per cent than 4.2 per cent in 2025. Global headline inflation continues to decline, reflecting easing food and energy prices, though inflationary pressures remain uneven across countries. The said report projected Bangladesh’s consumer price inflation at 8.5 per cent in December 2025 and 8.4 per cent in December 2026, reflecting gradual easing from double-digit levels as global and domestic price pressures subside.
This paper includes CPI data up to September 2025 from BBS. Numbers are rounded to one decimal. Q1:FY26 represents July-September, 2025.
In the first quarter (Q1) of the current fiscal year (FY26), Bangladesh’s year-on-year (y-o-y) CPI headline inflation eased further from the previous quarter, averaging around 8.4 per cent. Al though Bangladesh witnessed historically high inflation rates in the first two quarters of FY25, the moderation in inflation began in Q3 of FY25 and persisted through Q1 of FY26. Food inflation, which remained in double digits during the first half of FY25, fell to single digits in the last half of FY25 and declined further to 7.6 per cent by the end of Q1of FY26. On the other hand, in FY25 non-food inflation remained broadly stable at an elevated level, averaging around 9.5 per cent, and started to decline slightly in Q of FY26, averaging 9.1 per cent.
Month-on-month (m-o-m) headline inflation declined moderately in September 2025, while food inflation decreased sharply from the previous month. The m-o-m headline inflation remained positive, amounting to 1.0 per cent in September 2025 from 2.4 per cent in August 2025. M-o-m food inflation decreased to 1.2 per cent in September 2025 from 4.0% in August 2025. M-o-m non-food inflation remained stable during this period.
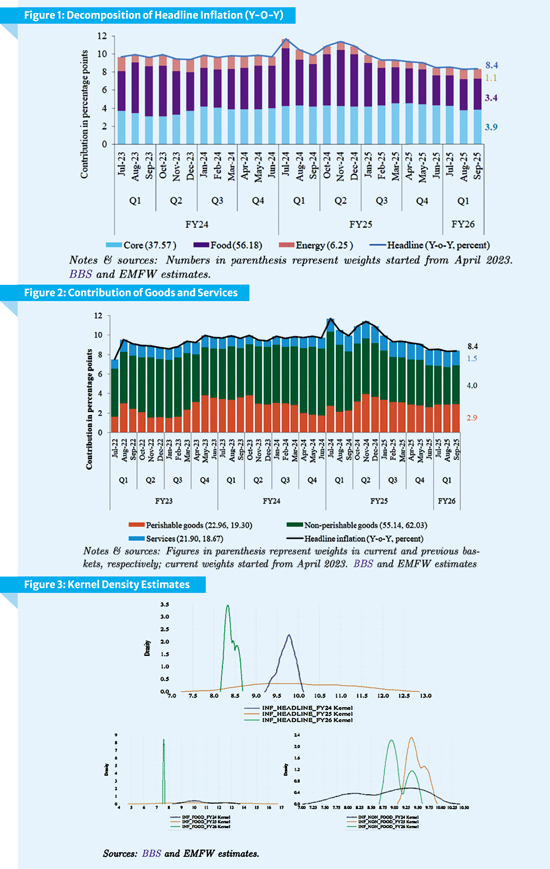
Decomposition of Headline Inflation: The contribution of core items to headline inflation dominated as usual throughout the first quarter of the current fiscal year. During this period, the average contribution of food inflation to headline inflation declined slightly, while the contribution from energy inflation increased. Specifically, the average contribution of core items to headline inflation accounted for 47.2 per cent in first quarter of FY26, slightly decreased from 49.7 per cent in the previous quarter. In contrast, the average contribution of food prices to headline inflation in first quarter of the current fiscal year fell to 40.6 per cent from 41.3 per cent in the preceding quarter. Meanwhile, energy items accounted for 12.2 per cent of the headline inflation during the quarter under review from 8.9 per cent in the preceding quarter. However, data shows that the recent uptick in energy inflation is mostly contributed by solid fuels such as cow dung, wood fires, jute sticks, etc.
Decomposition of Food Inflation: In the first quarter of the current fiscal year, cereals continued to be the dominant driver of food inflation in Bangladesh. On average, cereal products contributed 47.08 per cent to overall food inflation during the period under review, maintaining their position as the highest contributing category. This marks the highest quarterly contribution of cereals observed in recent periods, underscoring their significant influence on food price dynamics. Protein-based food items (milk, cheese, fish, egg, meat, pulses etc) also fuelled a notably role, accounting an average of 43.98 per cent to food inflation in the same period. Despite remaining a major component, their relative contribution declined slightly, reflecting a moderation in prices for certain protein items. In contrast, the contribution of vegetables to food inflation surged slightly in the first quarter of the current fiscal year. The average contribution of vegetables was up to 7.16 per cent in the quarter, compared to 5.50 per cent in the previous quarter, indicating a considerable hike in vegetable prices. In the meantime, edible oil’s contribution to the overall composition of food inflation dropped slightly and remained low. The average price level of spices and culinary essentials has fallen 7.57 per cent over the previous period.
Decomposition of Non-food Inflation: Non-food inflation remained persistently high at around 9.5 per cent throughout FY25. During the quarter under review, the primary contributors to non-food inflation were clothing and footwear, which accounted for 17.71 per cent, and energy (including solid fuel), which contributed 17.89 per cent. The contribution of clothing and footwear slightly decreased in the quarter under review compared to the previous quarter.
Energy remained a major component of non-food inflation, its contribution surged in the quarter relative to previous quarters. Meanwhile, contributions from other components of non-food inflation, such as transport, health, education, and miscellaneous goods and services, remained broadly stable.
Product-wise Drivers of Headline Inflation: Goods (Perishable and Non-perishable) and Services. The contribution of perishable goods (those that begin to spoil without refrigeration or freezing within seven days) to headline inflation increased in the Q1 of FY26 compared to the previous quarter, whereas the contribution from non-perishable goods declined over the same period. In the quarter under review, contribution of perishable goods increased to 34.1 per cent from 30.8 per cent in the last quarter of FY25. The average contribution of non-perishable goods decreased to 46.7 per cent from 50.8 per cent in the previous quarter, indicating some moderation in price pressures for these items. Meanwhile, the contribution of services to headline inflation increased marginally, rising to 19.2 per cent in Q1 of FY26 from 18.4 per cent in the preceding quarter.
Import-concentrated Items. In Q1 of FY26, the average contributions of import-concentrated (items which are fully or partially imported are classified as import-concentrated items) food items to headline inflation decreased, but the contribution of non-food items fuelled slightly from the previous quarter. Meanwhile, the contribution of domestic food items to inflation increased, though the non-food items to inflation declined minimally.
During the quarter, the average contribution of import-concentrated items to inflation decreased to 24.4 per cent from 26.1 per cent in the last quarter of FY25. Meanwhile, the contribution of domestic items to inflation in Q1 of FY26 increased to 75.6 per cent from 73.9 per cent in Q4 of FY25.
Retail and Wholesale Prices of Selected Commodities. During Q1 of FY26, the retail and wholesale prices of most of the selected commodities increased, except the retail price of potatoes. Notable price hikes were observed in green chili, lentil, onion, and sonali than that of the previous quarter. In July and August of 2025, sonali chicken experienced a significant price hike. However, September saw a sharp decline in both wholesale and retail prices. In addition, the Green Chili also experienced a substantial increase throughout the quarter following earlier declines.
At the end of the quarter, the meat-sonali, potato, egg-farm, and onion showed increased margins (the difference between retail and wholesale prices), except for lentil and rice-medium, which show relatively stable.
Base and Momentum Effects, Diffusion Index and Kernel Density Estimates of Inflation: In the first quarter of FY26, inflation across all major categories was largely driven by favourable base effects. In July 2025, except core, momentum effects outweighed the base effects, contributing to an increase in inflation. In August 2025, core inflation continued to benefit from negative momentum, supporting the easing of inflation. By the end of the first quarter of FY26, food, core, and energy inflation remained dominated by favourable momentum effects, which outweighed the negative base effect. The headline, food, core, and energy inflation increased slightly during this time. Looking ahead, all four categories of inflation are expected to continue benefiting from favourable base effects over the next twelve months, with a few exceptions.
Diffusion index for headline inflation increased on average in the first quarter of the current fiscal year compared to Q4:FY25, indicating that the majority of items within the overall CPI basket are experiencing price increases. It is to be noted that the CPI diffusion index (m-o-m), a measure of dispersion of price changes, categorises items in the CPI basket according to whether their prices have risen, remained stagnant, or fallen over the previous month.
In September 2025, out of the 382 commodities in the CPI basket 260 commodities recorded price increases, 31 registered price declines, and 91 remained unchanged compared to the previous month.
Headline and non-food inflation (m-o-m) increased in July 2025 and remained in positive territory in July 2025. However, in August 2025, headline inflation (m-o-m) edged up slightly despite a decline in the m-o-m diffusion index. This suggests that items with price increases carried a greater weight in the index. On the other hand, non-food inflation (m-o-m) remained stable throughout the quarter as prices of 217 out of 256 commodities in this category remained unchanged.
The Kernel Density Function (KDF) of headline inflation (y-o-y) for FY 26 (up to September 2025) exhibits leftward and steeper compared to FY25 indicating a lower variability of inflation rates. A KDF shows the distribution of data, indicating where the data is concentrated (steep parts) and how far it spreads out (tail length). Steeper parts indicate higher density and mean value, and longer tails show spread or variation of the data
The distribution for headline inflation of FY25 appears notably flatter and exhibits a rightward shift, reflecting a broader range of inflation rates. It indicates that inflation in FY25 exhibited greater volatility and elevated inflation rates.
In contrast, the distribution for FY26 (up to September 2025) indicates that inflation rates during this period were tightly clustered with low variability. The distribution for food inflation of FY25 appears notably steeper and exhibits a leftward shift, indicating less volatility and decrease in food inflation. Besides, the distribution for non-food inflation of FY26 appears moderately flatter and
exhibits a leftward shift, indicating moderate volatility and decrease in non-food inflation.
Wage Dynamics: Since April 2022, inflation has consistently exceeded wage growth, reducing consumers’ purchasing power and causing a decline in real income. However, from February 2025 onward, this gap began to narrow as the inflation rate moderated and saw a notable reduction, particularly in June 2025. In the first quarter of FY26, the wage-price gap again slightly widened than that of the previous quarter. This slight widening was primarily driven by a decline in wage growth rate. The Headline inflation and wage growth both eased to an average of 8.4 per cent and 8.0 per cent, respectively, in Q1 of FY26.
Despite some fluctuations due to momentum effects, wage growth remained sluggish throughout the quarter, as the negative base effect persisted.
Overall wage growth went to downward trajectory in Q1 of FY26 after end of the last quarter (Q4:FY25). Wage growth rates decreased marginally across all divisions except Dhaka and Chattogram in Q1of FY26 compared to the previous quarter. Among all divisions, Rangpur continued to record the highest wage growth.
Conclusion: In the first quarter of FY26, headline CPI inflation (y-o-y) continued to ease, averaging approximately at 8.4 per cent, down from the elevated levels observed in the FY25. The moderation in inflation that commenced in third quarter of FY25 continued to the first quarter of FY26. This moderate trend was mainly the results of a decline in food inflation, particularly from reduced contribution of spices and edible oil.
However, cereals remained the top contributor to food inflation accounting for 47.08 per cent of overall food inflation in Q1 of FY26. Energy items (including solid fuel) accounted for 9.9 per cent to the headline inflation in this quarter, though it maintained around 8.0 per cent in Q4 of FY25. Although energy prices increased, the contribution of core inflation has decreased. Overall, non-food inflation was slightly lower than that of the previous two quarters. Meanwhile, in Q1 of FY26, the wage-price gap saw a notable reduction than that of the second half of FY25. This narrowing was primarily driven by a decline in headline inflation (y-o-y), which eased to 8.4 per cent in September 2025, while wage growth remained relatively stable at 8.0 per cent. Household purchasing power is now showing signs of improvement. However, wage growth remains sluggish.
In this context, sustained policy vigilance is essential to further anchor inflation and maintain a stable macroeconomic environment conducive to long-term, inclusive growth.
Dr Md. Golzare Nabi is Executive Director (Research), Bangladesh Bank. Nurun Nahar Sultana is Director (Research); Alok Roy is Additional Director (Research); Md. Masudur Rahman is Joint Director (Research); and Md Jahedul Islam, Farah Nasreen, Md Ashik Ali and Mohua Akter are Assistant Directors (Research), Bangladesh Bank. nurun.sultana@bb.org.bd; alok.roy@bb.org.bd
[The piece is a slightly abridged version of the Inflation Dynamics in Bangladesh July–September 2025
(Q1:FY26). www.bb.org.b]