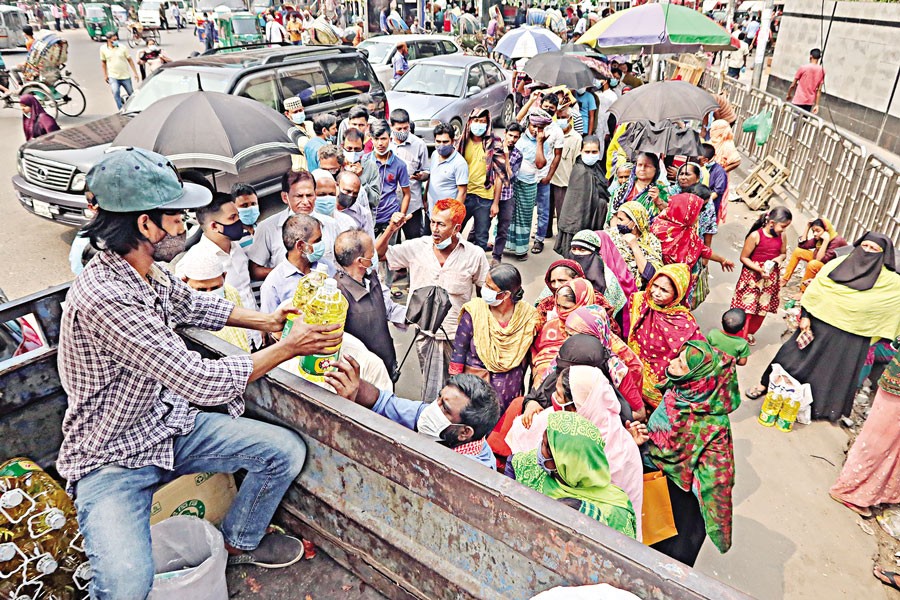
 Low-income people who have seen erosion in their real income in recent years have no option other than crowding the TCB vehicles that sell food items at subsidised prices — FE Photo
  Some of the findings of the 'Preliminary Report on Household Income and Expenditure Survey 2016' released by Bangladesh Bureau of Statistics toward the end of 2017 raised many eyebrows for good reasons. The earlier survey was conducted in 2010, i.e. six years before it. During this period the real GDP of the country had accelerated to its highest ever rate and grew by 45.5 per cent (2009/10 to 2015/16, Bangladesh Bank). This should have meant a considerable growth in the real income and welfare of the household sector since it comprises the entire population of the country (but excludes the government sector). Most surprisingly the survey found that the household income did not increase at all. (See "Where did the benefits of economic growth disappear?", The Financial Express, 18 December 2017 for a discussion.) The national accounts data also suggested that the per capita income increased by 31.6 per cent during the period 2009-10 to 2015-16, and yet they had received nothing in return. On the contrary household per capita income was reduced by 2 per cent, that is, their standard of living or welfare had actually declined. Such an unusual outcome, not seen before, certainly called for in-depth analyses of the underlying reasons. Unfortunately no serious efforts were made to do the necessary research.
Perhaps some might say it was a one-off finding and so it is not necessary to be overly worried about it yet. But was it really an aberration? It would have been possible to verify this possibility if we had another one or two such surveys. BBS is supposed to do the survey in this series every five years (originally it was three years), but it did the survey after six years last time, and there is no indication when the next one may be forthcoming although five years have already elapsed. It is customary in the more developed countries to provide aggregate household income data along with the national income data in the national accounts. Unfortunately BBS has not yet graduated to that level of capacity, and so we do not have any estimates of the income of the household sector or household disposable income. This hinders the analysis of household behaviour.
In the absence of estimates of household income from a competent source, we might look for credible alternatives whose data may be available. One such alternative is the regularly published wage rate data. There are some limitations of using such data. First, wages are not the only source of income of the households. They may have non-labour income such as rental and interest income, transfer income, or income from self-employment. These sources could earn considerable income for them in which case wage income will be a poor proxy for household income. Second, wage income depends on both the wage rate and the amount of time worked as a wage labourer. Thus, if the wage rate does not change but the amount of time spent on work increases then the wage rate will understate the wage income. However, if we could assume that the proportion of household income derived from non-wage sources remains roughly constant over time, then we could use the wage rate as a workable proxy for household income and welfare. If the amount of time spent on wage labour does not change appreciably then the wage rate is a good proxy for household income. Assuming that these conditions obtain in practice, we could regard the wage rate, for which we have data, as representative of the household income.
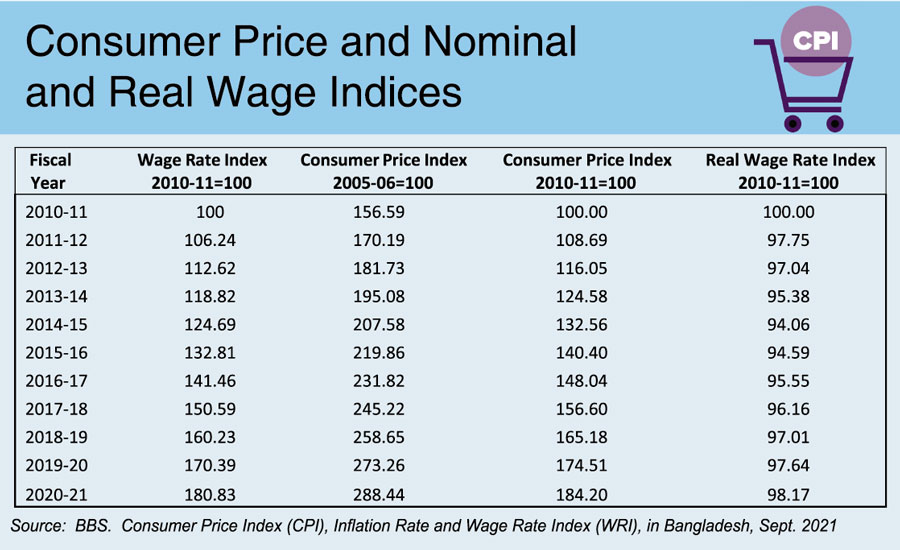
The wage rate index (WRI) and the consumer price index (CPI) are shown in column 2 and 3 respectively of Table 1. Both are nominal indices, but they are constructed with different base years. WRI is measured with 2010-11 as the base year while CPI is measured with 2005-06 as the base year. To make them directly comparable both are expressed with the same base year 2010-11. The original CPI is scaled down such that 2010-11 CPI=100 and the rest are adjusted similarly. The new series is shown in column 4. Note that the rate of change of consumer price implied by the original series in column 3 is exactly the same as that shown by column 4. Now deflating (dividing) WRI series by the new CPI series we get the series for the real WRI as shown in column 5.
The nominal WRI in column 1 of the table shows the nominal wage increased by 80.83 per cent during the entire decade, but the real WRI as shown in column 5 actually decreased by 1.83 per cent. What this means is that the entire increase in the nominal wage during this period was illusory (the so-called money illusion). The higher nominal wage (by 80.83 per cent) received in 2020-21 would not be sufficient to buy what the wage earner could buy with the much lower nominal wage in 2010-11. The workers toiled hard with the rest of the population to raise the income of the nation by 45.5 per cent, but they did not get any share of this increased income. On the contrary 1.83 per cent of their initial real income was diverted to some other groups such that they had to survive on less.
If one wants to be an incorrigible optimist this table provides an opportunity to find 'a silver lining' in the dark cloud. Note that the real wage rate declined over the decade, but it actually rose by 4.44 per cent during the last six years which gives the optimists something to cheer about. The real story is that the real wage fell rapidly over the first four years, and ever since it has been clawing up, but still not making up to the 2010-11 level.
 A question that inevitably arises is where did the higher national income of the decade disappear? A simple first response is that anyone whose nominal income increased by more than the increase in CPI (84.20 per cent) not only maintained their 2010-11 real income, but they also received a share of the increased income. Whether, and to what extent, they deserved the additional income is a devilishly difficult question that is beyond the scope of this short essay. A satisfactory answer will have to delve outside recorded household income and GDP.
When everyone does not get the same proportionate increase in their real income as the increase in the aggregate income, the distribution of income deteriorates. The state of the income distribution is often represented by Gini coefficient, the value of which ranges from 0 to 1. Perfect equality, meaning every person gets the same income, is indicated by the Gini value of 0, while perfect inequality, when just one person gets all the income and the rest nothing, is shown by the value of 1.
The Gini coefficient for Bangladesh has increased over time steadily from 0.350 in 1983-84 to 0.467 in 2005 implying a stubborn worsening of the income distribution with economic development. Then it unexpectedly improved to 0.458 in 2010 raising hope of a move to a more egalitarian society. But it was dashed when the Gini coefficient for 2016 was estimated at an all time high 0.483. Not only was it a substantial deterioration in the Gini coefficient, but it also pushed Bangladesh into the rank of very unequal societies. There were less than 20 countries which were more inegalitarian than Bangladesh. It is disappointing that in just over three decades a modestly egalitarian country turned into a very unequal one.
Income distribution is a complex issue that is determined by numerous economic, institutional and legal factors that are often difficult to explain. But it needs to be investigated properly to understand the underlying forces so that appropriate policies may be put in place to reverse the trend. This is not just an ethical matter; economists around the world are becoming increasingly aware of the adverse consequences of a skewed income distribution that can upend decades of development.
The author of the article is a professor of economics at the Independent University of Bangladesh (IUB).
m_a_taslim@yahoo.com
© 2026 - All Rights with The Financial Express