Sayera Younus, Nurun Nahar Sultana, Md Abdul Karim, and Ripon Roy | June 02, 2024 00:00:00
 Bangladesh Bank prioritises maintaining price stability as its primary goal. It is crucial for the development of monetary policy to observe and comprehend the root causes of fluctuations in consumer prices and wage levels. Bangladesh Bureau of Statistics (BBS) publishes multiple indices to reflect the price levels of the economy. This paper tries to explore the driving forces of inflation and wages in Bangladesh’s economy.
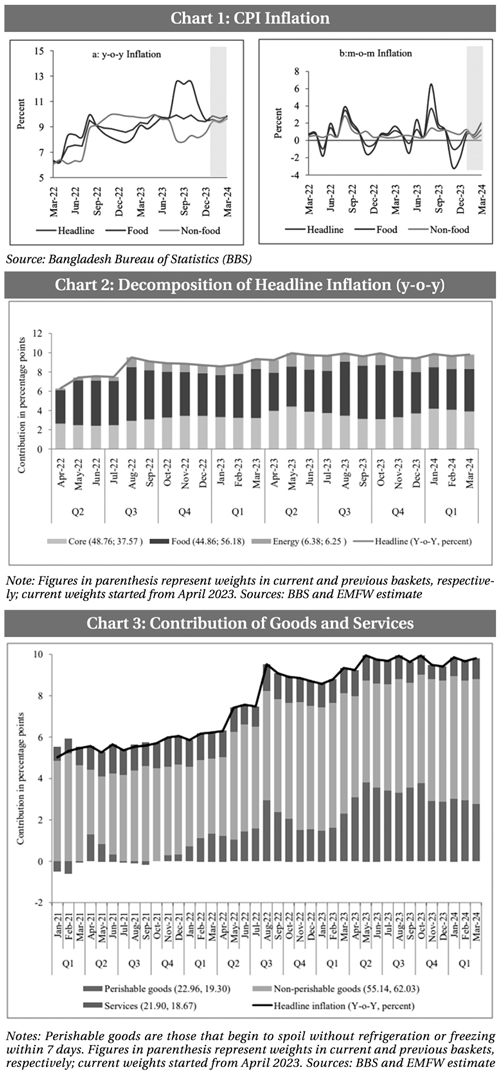
The Consumer Price Index (CPI), based on year-on-year (y-o-y) headline inflation during the first quarter Q1 of the current year (January–March 2024) remained elevated around 10 per cent (Chart 1a), food and non-food y-o-y inflation also maintained higher trajectory. Month-on-month (m-o-m) food and non-food inflation fluctuated to a positive path during the period under review. As a result, m-o-m headline inflation also experienced upward pressure. Moreover, y-o-y headline inflation drifted to a corridor between nine to ten per cent in last one year, which was comparatively higher than the desired level.
Decomposition of Headline Inflation: During January-March 2024, the average headline inflation stood at 9.8 per cent (y-o-y), where more than half of this growth came from core and energy Consumer Price Indices (CPIs) and the remaining came from 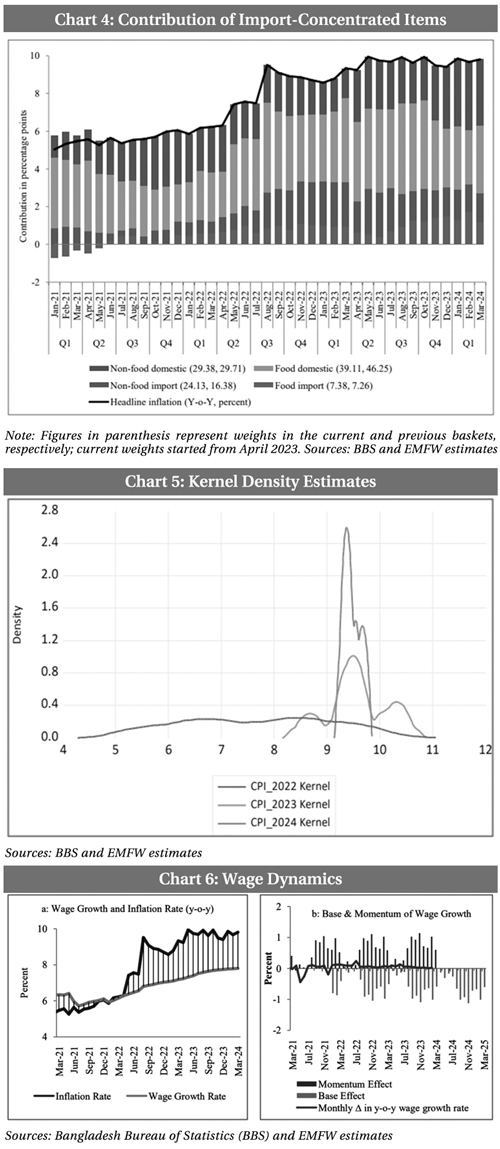 food items (Chart-2). In the previous quarter (October-December 2023), the y-o-y headline inflation was at an average of 9.6 per cent where major portions contributed by elevated food CPI and, the remaining came from core and energy prices. The contribution of food prices to headline inflation stood at 45 per cent in March 2024, while contribution of core and energy were 40 and 15 per cent respectively. It is observed from the graph that when inflation was in lower territory say, around 6-7 per cent, food inflation contributed mostly to headline inflation. On the other hand, when inflation up ticked to around 10 per cent energy and non-food inflation emerged as the major driving forces for headline inflation.
Decomposition of Food Inflation: Food CPI experienced an average of around 10 percent (y-o-y) inflation in 2023. In March 2024, food inflation was also around 10 per cent, where more than half of this inflation was contributed by protein-based food prices. The contribution of protein prices accentuated from the beginning of 2023, while spices & culinary essentials started contributing prominently from August 2023. However in recent quarters, the decline in prices of cereals and edible oils contained food inflation from surging further.
Decomposition of Non-food Inflation: Since September 2023, non-food inflation (y-o-y) has been on a rising trajectory, and during 2023, it was at an average of 9 per cent. About one-fourth of this growth was attributed to energy inflation, while restaurants, hotels, recreation prices, and health, personal care prices contributed each by approximately 10 per cent. Non-food inflation was elevated in the first quarter of 2024 as well and reached 9.3 per cent, mostly contributed by energy, restaurant prices and other items which consist of tobacco, jewellery, travel accessories and some service items. Meanwhile, during January-March 2024, contribution of furniture appliances, clothing and footwear prices remained broadly stable. Furthermore, surge in electricity prices in March 2024 resulted into change of energy contribution from 2.5 to 2.7 percentage point. [Non-food inflation slightly differs from the published report of BBS because, following the new basket, tobacco items have been removed from the old basket’s food items and treated as non-food items. Current weights and base 2021-22=100 was started from April 2023, prior to that previous base 2005-06=100 has been rebased to 2021-22=100 based on previous weight.]
Contribution of Goods and Services to Headline Inflation: During January-March 2024, the contribution of services and non-perishable goods to headline inflation was increasing, while the contribution of perishable goods to headline inflation was slightly decreasing. In March 2024, the contribution of services and non-perishable goods to headline inflation was 10 percent and 67 per cent respectively, which was 7 per cent and 68 per cent in December 2023 respectively (Chart-3). Meanwhile, the contribution of perishable goods to headline inflation was 32 per cent in January 2024, which was 33 per cent in December 2023.
Contribution of Import-concentrated Items to Headline Inflation: The contribution of import-concentrated items to inflation started to increase in August 2022, mainly due to the rise in international prices (Chart-4). Here, fully or partially imported items are classified as import-concentrated. Moreover, items requiring imported input materials are also considered import-concentrated. During July 2023-March 2024, import concentrated items contributed, on average, one-third of the headline inflation. In January 2024, the contribution of import-concentrated items to inflation decreased to 27.5 per cent from 32.3 per cent in December 2023, due to the fall in inflation of food import-concentrated items. Meanwhile, the contribution of domestic items to inflation increased to 72.5 per cent from 67.7 per cent in December 2023, due to the increase in inflation of both domestic food and non-food CPI.
Base and Momentum Effects: In 2023, large price momentum dominated over the base effect which exhibited rising inflation rate in Bangladesh. However, during June-October 2023, base effect offset price momentum, helping to restrict the rising pressure in headline inflation. In November and December, the signs of the base effect and momentum effect reversed, resulting in a small fall in inflation. In the first three months (Jan-Mar) of 2024, the base effect offset price momentum, resulting in a minor change in inflation. Based on the base effect calculated for the twelve months ahead, base effects are negative and may offset the price momentum which might result in smaller changes in headline inflation in Jan-Mar 2025. A similar situation of headline inflation is observed in food inflation with high volatility. However, core and energy inflation will experience a negative base effect for all months of 2024.
[The difference between the annual inflation rates in two consecutive months is approximately equal to the difference between the m-o-m inflation in the current month and the m-o-m inflation twelve months ago, which can be expressed as: Current month’s y-o-y inflation = y-o-y inflation of the previous month + base effect (m-o-m inflation twelve months ago) + momentum effect (m-o-m inflation in the current month).]
Diffusion Indices: Diffusion indices (a metric that measures the dispersion of price fluctuations) for headline and non-food picked up at the end of March 2024 resulting in increased m-o-m headline and non-food inflation. Even though, the diffusion index for food items slightly dropped in the mentioned period, the food inflation (m-o-m) was high which indicates that the number of items which has seen price rise holds significant weight in the food CPI basket. It may be mentioned that, in August 2023, the higher weights of price-increased items compared to price-decreased items caused opposite moves in DIs and inflation.
Kernel Density Estimates: A Kernel Density Function (KDF) shows the distribution of data, indicating where the data is concentrated (steep parts) and how far it spreads out (tail length), longer tails show spread or high variation in the data. [A KDF shows the distribution of data, indicating where the data is concentrated (steep parts) and how far it spreads out (tail length). Steeper parts indicate higher density and mean value, and longer tails show spread or variation of the data. Kernel density estimation is a useful statistical tool for creating a smooth curve given a set of data. This can be useful for visualising just the shape of some data as a kind of continuous replacement for the discrete histogram.]
The KDF indicated that average CPI headline inflation increased in 2023 but with less volatility compared to 2022 as shown by the shape of the distribution (Chart-5). The mean value of CPI inflation has increased to 9.57 per cent in 2023 from 7.67 per cent in 2022. The CPI headline inflation had the largest standard deviation in 2022, as shown by the longer tail in the Kernel density distribution. The shape of the Kernel density function had shifted in 2024, with a larger mean value and a smaller standard deviation compared to 2023, indicating that the CPI inflation is concentrated at 9.50 percent with a minor change every month.
Retail and Wholesale Prices: While the margins ((the difference between retail and wholesale prices) for rice (medium) and eggs (farm) experienced a decline in January 2024 compared to the preceding month, but subsequent months witnessed a rise in margins. Conversely, the average margins of potato, onion and green chili elevated during the third quarter of FY24 compared to the previous quarter. Notably, in March 2024, lentils demonstrated a significant increase in margin after experiencing a stable retail and wholesale price difference, reaching a peak within the observed timeframe. Soybean oil and meat-sonali, however, maintained relatively consistent margins throughout the quarter. Therefore, the rise of margin of the aforementioned necessary items signals the need of proper market intervention and implementation.
Wage Dynamics: Since April 2022, inflation has remained on a higher trajectory compared to wage rate growth (Chart 6a), implying lower purchasing power for consumers and a subsequent fall in real income. The momentum effect of Wage Rate Index (WRI) was offset by base effect causing slower wage growth since August 2023 (Chart 6b). The projected base effects up to March 2025 are showing larger negative magnitudes except April-August, implying negative impacts of base effects on wage growth.
Among the overall wage growth rates of seven divisions in Bangladesh, Rangpur stands out with the highest wage growth rate since October 2023 may be due to uneven development activities, migration, natural calamities, and geographical challenges. However, there are signs that this growth is similar to other divisions following different government initiatives, including establishing the Export Processing Zone (EPZ). In January 2024, wage growth in all the divisions was almost similar, whereas Sylhet experienced the slowest growth.
Concluding note: Inflation has remained elevated at around 10 per cent during January-March 2024 with almost similar contribution of food and non-food items. While food inflation is mostly driven by the protein based food items, spices and other culinary essentials, non-food inflation is induced by energy inflation. The contribution of perishable items to inflation emerged significantly in 2023 and remained steady during first three months of 2024. Though there is slight drop in the contribution of import-concentrated items at March 2024, the ongoing depreciation pressure may change this movement in coming months.
The analysis of wage trends indicates a potential decline in real income for consumers, as inflation has outpaced wage rate growth since April 2022 and stayed on the negative territory at the end March 2024. While certain regions, notably Rangpur, exhibit positive wage growth, concerns arise over the slowing momentum. Currently, higher inflation is a challenge for the Bangladesh economy. Monetary and fiscal policies have prioritised the containment of inflationary pressure. In addition to continuous increases in the monetary policy rate (repo rate) to reduce inflationary pressure, BB has stopped lending to the government by increasing reserve money. Furthermore, the government has implemented a variety of austerity measures to ensure effective fiscal management. Looking ahead all of the policy initiatives implemented by the central bank and the government aim to anchor inflation expectations. They are expected to have a positive impact on inflation outcomes in the coming months.
The piece is slightly abridged version of “Quarterly Report on Inflation Dynamics in Bangladesh: January-March, 2024” prepared and published by Economic Modelling and Forecasting Wing of the Research Department of Bangladesh Bank. www.bb.org.bd
Dr Sayera Younus is Executive Director (Research), Bangladesh Bank (BB). Nurun Nahar Sultana is Director; Md Abdul Karim, and Dr Ripon Roy are Additional Director of the research department of BB.
Tarek Aziz, Alok Roy and Nabila Fahria, Joint Director; Rupok Chad Das, MdYousuf, and Md. Masudur Rahman, Deputy Director; Mohammod Ullah, Rozina Akter, and Farah Nasreen, Assistant Director of the research department of BB
contributed to the paper.
sayera.younus@bb.org.bd, nurun.sultana@bb.org.bd, ripon.roy@bb.org.bd, alok.roy@bb.org.bd
© 2026 - All Rights with The Financial Express