One of the more intriguing facts in modern economics is that the value of the United States (US) stock market substantially exceeds the country's annual Gross Domestic Product (GDP), while in many other nations' stock market capitalisations and GDPs are roughly equal. At first glance, this appears paradoxical. How can the value of listed companies exceed the value of everything produced in a year?
The answer lies in the fundamental difference between what GDP measures and what stock markets value. GDP is an annual flow of goods and services produced within a country's borders during a single year. Stock market capitalisation, by contrast, is a stock measure representing the discounted present value of expected future profits. One measures current production; the other measures future earning power. Because stock markets look forward while GDP looks backward, a substantial gap between the two is not only possible but often expected.
A second distinction is that GDP measures economic activity occurring within national borders, whereas stock market capitalization reflects the value of companies wherever they earn their profits. American corporations generate substantial revenues and profits throughout the world. Apple, Microsoft, Nvidia, Alphabet, Amazon, and Meta derive a significant share of their earnings from international markets. GDP captures only the portion of their activities occurring within the US, while market capitalization reflects investors' expectations regarding future profits generated across the globe. In effect, US stock valuations incorporate worldwide income streams that never appear in US GDP statistics.
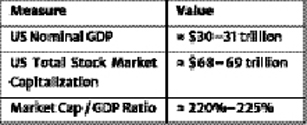
Using year-end 2025 estimates, the US stock market was worth about $69 trillion, while GDP was roughly $31 trillion, producing a market-cap-to-GDP ratio near 221 per cent.
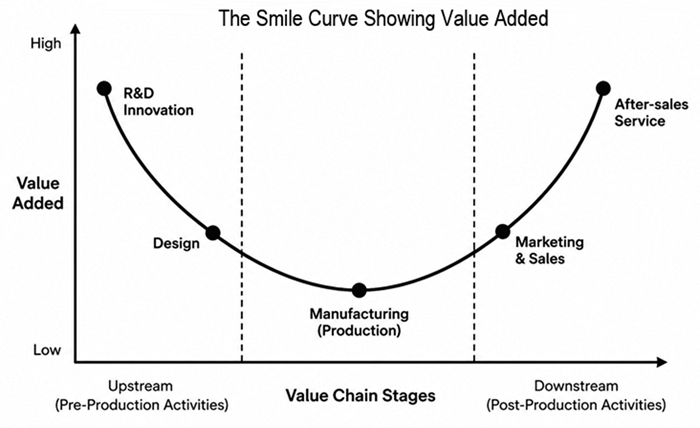
The phenomenon can also be understood through the smile curve of value creation. The greatest profits are often captured at the two ends of the production process: research and development on one side, and branding, marketing, finance, logistics, and distribution on the other. The middle-the physical manufacturing and assembly stage-typically earns the smallest share of value added. Many American firms dominate these highly profitable ends of the smile curve. Their market valuations therefore reflect control over ideas, technology, intellectual property, software ecosystems, global brands, and financial networks rather than merely the value of physical goods produced. Countries that primarily occupy the manufacturing middle of the smile curve may generate substantial output yet capture only a modest share of the profits.
This distinction highlights the growing importance of intangible capital. Traditional economies were built upon factories, machinery, land, and physical infrastructure. Today's leading corporations increasingly derive their value from patents, algorithms, software, data, trademarks, and intellectual property. Unlike physical assets, these intangible assets can be scaled globally at very low marginal cost. A steel mill can produce only so much steel, but a software platform can add millions of users without constructing another factory. Financial markets place high valuations on such scalable future earnings, causing market capitalization to rise far faster than GDP.
The depth and sophistication of financial markets further magnify this effect. The U.S. possesses the world's largest, most liquid, and most trusted capital markets. Pension funds, mutual funds, insurance companies, sovereign wealth funds, and individual investors from around the world continuously channel savings into American equities. This enormous pool of capital increases demand for shares and supports higher valuations than would be expected from domestic GDP alone.
Institutional quality also matters. Investors place a premium on countries with reliable property rights, transparent accounting standards, independent courts, strong corporate governance, and predictable regulatory environments. Future profits are worth more when investors have confidence that those profits will be protected and enforceable. The rule of law, therefore, acts as a valuation multiplier. Countries with weaker institutions often experience lower stock valuations even when their economies are productive.
Another frequently overlooked factor is the way corporations are financed. The US relies heavily on public equity markets to fund business expansion. Much of corporate wealth therefore becomes visible through stock exchanges. By contrast, countries such as Germany traditionally rely more on bank-centered financing. Many highly successful firms remain privately held, family-owned, or financed through commercial banks rather than public stock markets. These firms contribute significantly to GDP but do not appear in market-capitalization statistics. Consequently, stock market value remains closer to GDP even though economic performance may be strong.
Pension systems also influence market size. In the US, retirement savings flow heavily into 401(k) plans, IRAs, mutual funds, and pension portfolios invested in equities. This creates a continuous institutional demand for stocks. In countries with large state-funded pay-as-you-go pension systems, household savings often bypass equity markets altogether. The result is a smaller stock market relative to GDP.
Interest rates provide another important explanation. Stock prices reflect the present value of future earnings. Lower interest rates reduce the discount rate applied to those earnings and thereby increase stock valuations. Over the past several decades, the U.S. has benefited from relatively low borrowing costs and deep capital markets. Investors have consequently been willing to pay higher multiples for future growth. Higher interest-rate environments generally produce lower market valuations relative to GDP.
The dollar's status as the world's principal reserve currency amplifies all these forces. Governments, central banks, corporations, and investors around the world hold dollar-denominated assets as stores of value. As global savings flow into American financial markets, US equities enjoy a structural valuation premium unavailable to most other countries. The world's confidence in the dollar effectively raises the value of American financial assets beyond what domestic economic activity alone might justify.
The distribution of income between labour and capital also matters. Countries with identical GDP levels can exhibit very different stock market valuations depending on how national income is divided. Where a larger share of economic output accrues to corporate profits, stock market capitalization naturally rises. Where more output flows to wages, social programs, or public-sector expenditures, stock market valuations tend to be lower. The Anglo-American economic model generally channels a larger share of income toward corporate earnings than many continental European systems, contributing to higher equity valuations.
International comparisons illustrate these differences clearly. Switzerland frequently records stock market capitalisation well above GDP because of globally dominant pharmaceutical and financial firms. Germany, despite its formidable industrial strength, often exhibits a lower ratio because many successful enterprises remain privately owned. Australia's ratio tends to hover closer to GDP because its market is concentrated in banking and natural-resource companies. China, despite possessing one of the world's largest economies, typically maintains a lower ratio than the U.S. because of state ownership, regulatory constraints, and differences in capital-market development.
Taken together, these factors reveal that the ratio of stock market capitalisation to GDP is far more than a financial statistic. It serves as a window into how nations create, capture, and retain economic value. Countries concentrated in manufacturing, commodities, agriculture, and domestic services may produce large volumes of output yet capture a smaller share of global profits. Countries that dominate innovation, intellectual property, software, finance, branding, and global distribution occupy the profitable ends of the smile curve and retain a disproportionate share of value added.
A further insight emerges from these international comparisons. Wealth alone does not create an extraordinarily large stock market. Many countries are wealthy because of natural resources, yet their market capitalisation remains relatively close to GDP. The distinguishing factor is often innovation. For example, a barrel of oil produces income once; a patented technology can produce income repeatedly for decades. A factory expands output incrementally; a software platform can serve millions of additional users at minimal cost.
Viewed through this lens, the gap between stock market capitalisation and GDP is not merely a measure of financial wealth, but a measure of where economic power resides. In a well-functioning economy, GDP growth and stock market value often reinforce one another, yet the decisive factor is not the volume of current output but the ability to transform knowledge, technology, and intellectual property into scalable future earnings.
In the twenty-first century, value increasingly belongs not to those who merely manufacture products, but to those who create ideas, control technology, own brands, and command the global channels through which value flows. The stock market therefore reflects not simply what an economy produces today, but what investors believe will continue to earn tomorrow. That is why America's market capitalization towers over its GDP, while many other nations remain much closer to parity.
Dr Abdullah A. Dewan is Professor Emeritus of Economics at Eastern Michigan University (USA); former physicist and nuclear engineer at the Bangladesh Atomic Energy Commission (BAEC). aadeone@gmail.com
© 2026 - All Rights with The Financial Express